

The GNSS data processing requires the reference station positions in the same reference frame and at the same observation epoch as the satellite orbits. The weekly station positions of the SIRGAS Continuously Operating Stations (SIRGAS-CON network) satisfy these requirements and therefore, it is highly recommended to use SIRGAS-CON stations with their weekly positions as reference points for precise GNSS positioning in the SIRGAS region. If the reference points in a GNSS positioning are not continuously operating SIRGAS-CON stations (i.e. their weekly positions are not available), it is necessary to translate the reference coordinates to the observation epoch applying the so-called velocities. It is desirable that the velocities of reference stations be derived from iterative GNSS measurements covering a minimum time span of two years. If this is not possible, and the velocities of the reference stations are unknown, they may be derived from a velocity or deformation model. Based on the SIRGAS reference frame solutions, a velocity model for SIRGAS, called VEMOS, is regularly updated. It should be noted that the VEMOS releases represent mean yearly horizontal surface displacements for the actual covered periods only. Co-seismic effects (jumps) must be considered in addition. The VEMOS models released so far are:
VEMOS2003
The first VEMOS model was released in 2003 and is based on the position differences between the SIRGAS95 and SIRGAS2000 frames, 48 velocities derived from the multi-year solution DGF01P01 and 231 velocities from several geodynamic projects based on episodic GPS campaigns. The different data sets were transformed to a common kinematic datum by deriving the rotation vector of the South American plate from the SIRGAS-CON station motions located in the rigid eastern part of South America and reducing these plate motions from all the data sets. The resulting residual motions were modelled to represent a continuous deformation field applying two different strategies: the finite element method (FEM) and a geodetic least squares collocation approach (LSC) with empirically determined covariance functions. The comparison of both methods shows an agreement in the mm/a level. VEMOS2003 covers the South American area between the latitudes 45° S and 12° N. More details in:
Drewes H., Heidbach O. (2005). Deformation of the South American crust estimated from finite element and collocation methods. In: Sansò F. (Ed.) A Window on the Future of Geodesy, IAG Symposia 128: 544-549, Springer, doi: 10.1007/3-540-27432-4_92.
VEMOS2009
The second VEMOS model was released in 2009. It considers 496 station velocities; 95 of them corresponding to the SIRGAS multi-year solution SIR09P01 and the others derived from repetitive GPS campaigns. It covers the area between the latitudes 56° S and 20° N and the time span from January 2, 2000 to June 30, 2009. The continuous surface velocity field was derived applying the finite element method (FEM) and a least square collocation (LSC) with empirically determined covariance functions. The main advantages of VEMOS2009 with respect to VEMOS2003 are the increased number of input velocities, the better quality of measurements (due to an increase of continuously operating GNSS stations), and the extension of the velocity field to the Caribbean and the southern part of Chile and Argentina. The mean precision of VEMOS2009 is about 1.5 mm/a. Further details in:
Drewes H., Heidbach O. (2012). The 2009 Horizontal Velocity Field for South America and the Caribbean. In: Kenyon S., M.C. Pacino, U. Marti (Eds.), “Geodesy for Planet Earth”, IAG Symposia, 136: 657-664, doi: 10.1007/978-3-642-20338-1_81.
VEMOS2015
The SIRGAS Velocity Model (VEMOS2015) was inferred from GNSS (GPS+GLONASS) measurements gained after the strong earthquakes occurred in 2010 in Chile and Mexico. It is based exclusively on the multi-year solution SIR15P01, which comprises 456 continuously operating GNSS stations covering a five years period from March 14, 2010 to April 11, 2015. VEMOS2015 covers the region from 55°S, 110°W to 32°N, 35°W with a spatial resolution of 1° x 1°. The average prediction uncertainty is ±0.6 mm/a in the north-south direction and ±1.2 mm/a in the east-west direction. The maximum is ±9 mm/a in the Maule deformation zone (Chile) while the minimum values of about ±0.1 mm/a occur in the stable eastern part of the South American plate. VEMOS2015 is available at https://doi.pangaea.de/10.1594/PANGAEA.863132. When using VEMOS2015, please always quote the following citation:
Sánchez L., Drewes H. (2016): VEMOS2015: Velocity and deformation model for Latin America and the Caribbean, doi: 10.1594/PANGAEA.863131, supplement to:
Sánchez L. Drewes H. (2016): Crustal deformation and surface kinematics after the 2010 earthquakes in Latin America. Journal of Geodynamics, doi: 10.1016/j.jog.2016.06.005.
VEMOS2015 is only valid for the period from March 2010 to April 2015. For the translation of station positions before the 2010 earthquake, the model VEMOS2009 may be more appropriate, in particular, for Chile and the western part of Argentina.
VEMOS2017
VEMOS2017 was derived from pointwise station velocities inferred at 515 geodetic sites from January 1, 2014 to January 28, 2017 using a geodetic least-squares collocation approach with empirically determined covariance functions. VEMOS2017 describes the present-day deformation in Latin America and the Caribbean and continues the surface-kinematics model represented by VEMOS2015, which is valid from March 14, 2010 to April 11, 2015. VEMOS2017 covers the region from 120°W, 55°S to 35°W, 32°N with a spatial resolution of 1° x 1°. The average uncertainty of VEMOS2017 is assessed to be ±1.0 mm/a in the north-south direction and ±1.7 mm/a in the east-west direction. The maximum uncertainty values (up to ±15 mm/a) occur at the zones affected by recent strong earthquakes (in the Maule area, the northern part of Chile, Ecuador and Costa Rica). The best uncertainty values (about ±0.1 mm/a) result in the stable eastern part of the South American plate. When using VEMOS2017, please always quote the following citation:
Drewes H. and Sánchez L. (2020): Velocity model for SIRGAS 2017: VEMOS2017, doi: 10.1594/PANGAEA.912350, Technische Universitaet Muenchen, Deutsches Geodaetisches Forschungsinstitut (DGFI-TUM), IGS RNAAC SIRGAS, supplement to:
Sánchez L., Drewes H. (2020): Geodetic monitoring of the variable surface deformation in Latin America. International Association of Geodesy Symposia Series, Vol 152, doi: 10.1007/1345_2020_91.
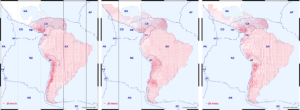
Left: VEMOS2009 ( Drewes H., Heidbach O., 2012); Center: VEMOS2015 (Sánchez L., Drewes H., 2016); Right: VEMOS2017 (Drewes H., Sánchez L., 2017)